Getting started
Interface overview
The parts of the Plexora window, and the words the app uses for them.
The viewer is one image with a sidebar beside it. The sidebar holds everything about how the image is drawn; the menu bar opens tools and pages.
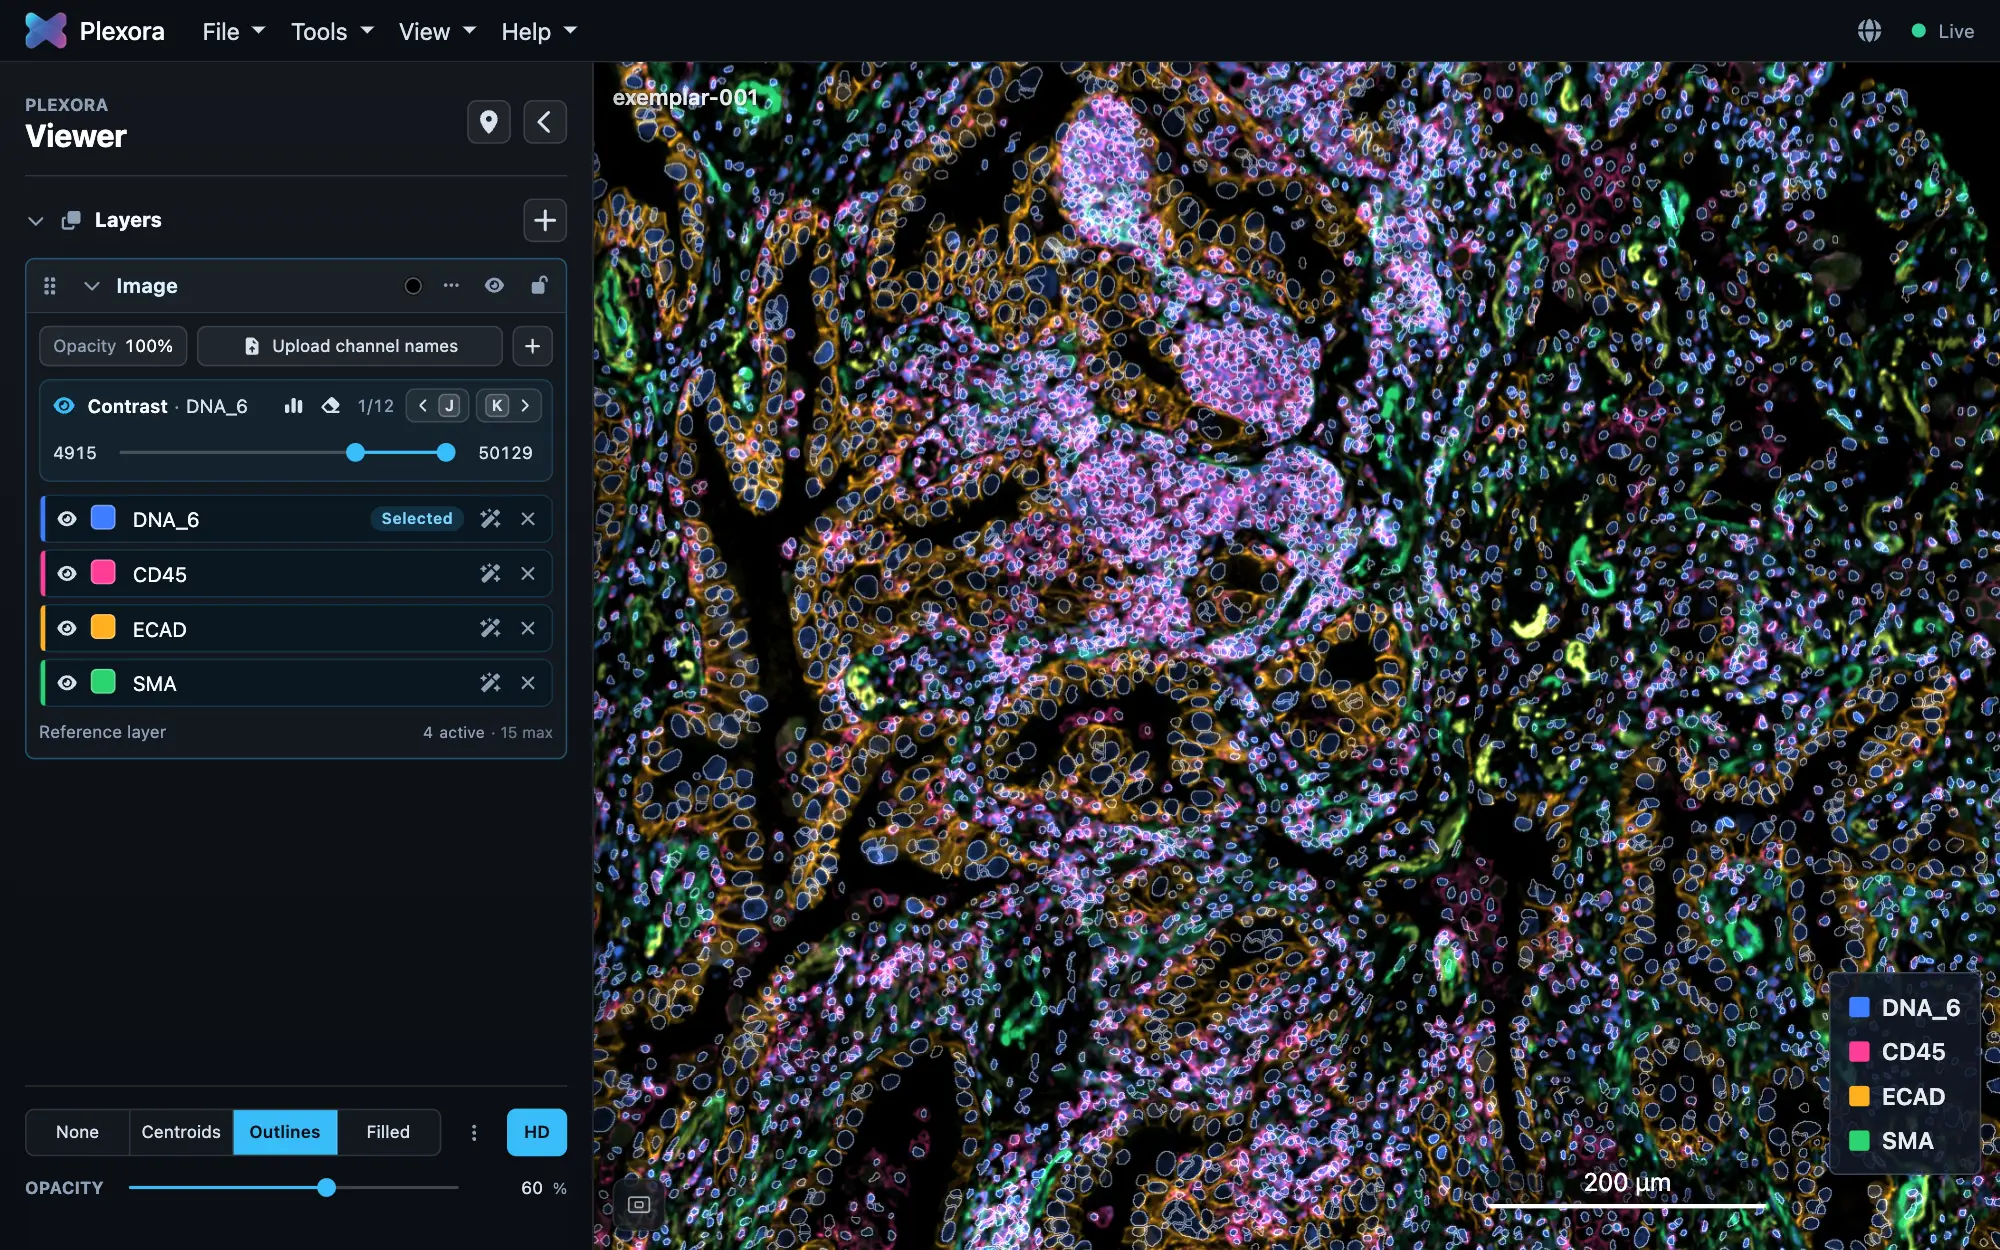
The parts of the window
- Menu bar. File (Import Sample…, Samples…, Export Image, Settings…), Tools (the plugins), View (Rotate & Flip, Scalebar) and Help.
- Sidebar header. One-click buttons for some tools, and Saved views.
- Image card. The image's channels: which are on, their colours and contrast. See Channels and contrast.
- Layers. Anything drawn over the image, one card each. See Layers.
- Cells row. How cells are drawn: None, Centroids, Outlines or Filled, plus HD. See Segmentation and cell data.
- The image. Drag to pan, scroll to zoom. Zoom and Home buttons sit on the left edge; the overview map opens from the bottom-left corner.
- Previous / Next sample. Top right, when the sample is in a dataset (B and N).
- Depth strip. Along the bottom, only for a z-stack or a time series. See Image viewer.
Tool cards open in the sidebar and stay open side by side. ⌘\ (Ctrl+\ on Windows and Linux) collapses the sidebar.
Words the app uses
| Word | Means |
|---|---|
| Sample | One image and everything attached to it. Python and the command line call it a project. |
| Dataset | A named group of samples, such as a cohort. It holds names, not data. |
| Channel | One marker in the image, shown in a colour you choose. |
| Layer | Anything drawn over the image: another image, a mask, points. |
| Segmentation mask | A label image with one number per cell, made before Plexora. |
| Cell table | One row per cell. Its columns are markers (intensities) or metadata (everything else). |
| Tool | A plugin, opened from the Tools menu. |