Segmentation and cell data
Add a segmentation mask and a cell table to a sample, then draw cells as points, outlines or filled shapes.
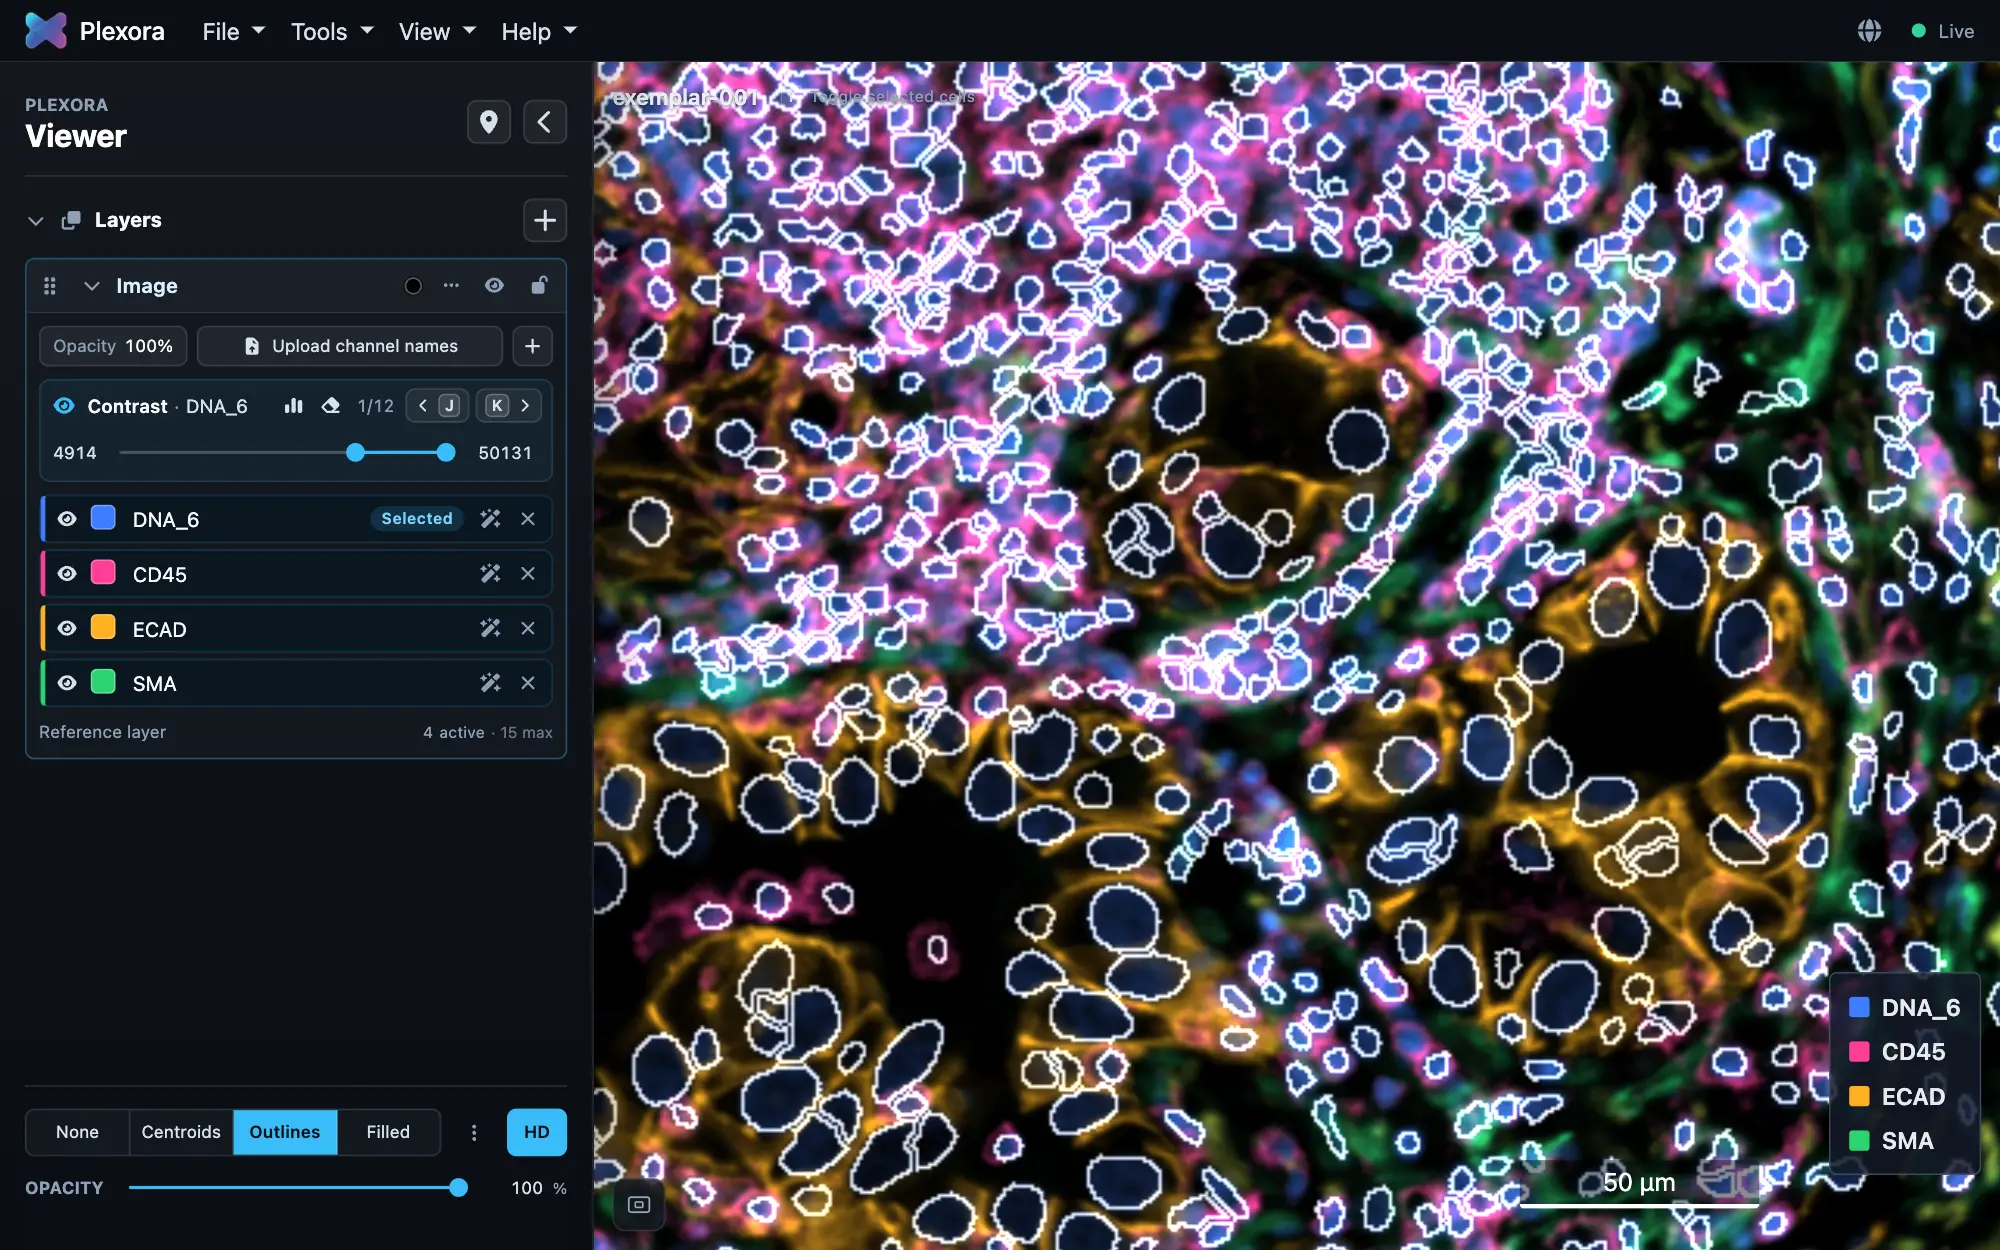
A segmentation mask outlines every cell; a cell table holds one row per cell with its position and marker values. Add either or both to a sample, and the Cells row at the foot of the sidebar draws the cells over the image.
How to use it
Add a mask or a table
Add them in the same Import Sample… dialog as the image. For a sample you already have, the Cells row shows a link naming what is missing, Add Seg Mask, Add Data or Add Seg Mask / Data, which opens the dialog for that sample. A mask is a label image (TIFF or OME-TIFF, one whole number per cell); a table can be CSV, TSV, Parquet or AnnData (.h5ad).
Let the mask convert
The first time, Plexora converts the mask into tiles so it draws at every zoom level. This can take a few minutes for a whole slide and happens once. Close the progress window with Continue viewing and keep working; the chip in the menu bar reopens it. When it finishes, the outlines appear by themselves.
Choose how cells are drawn
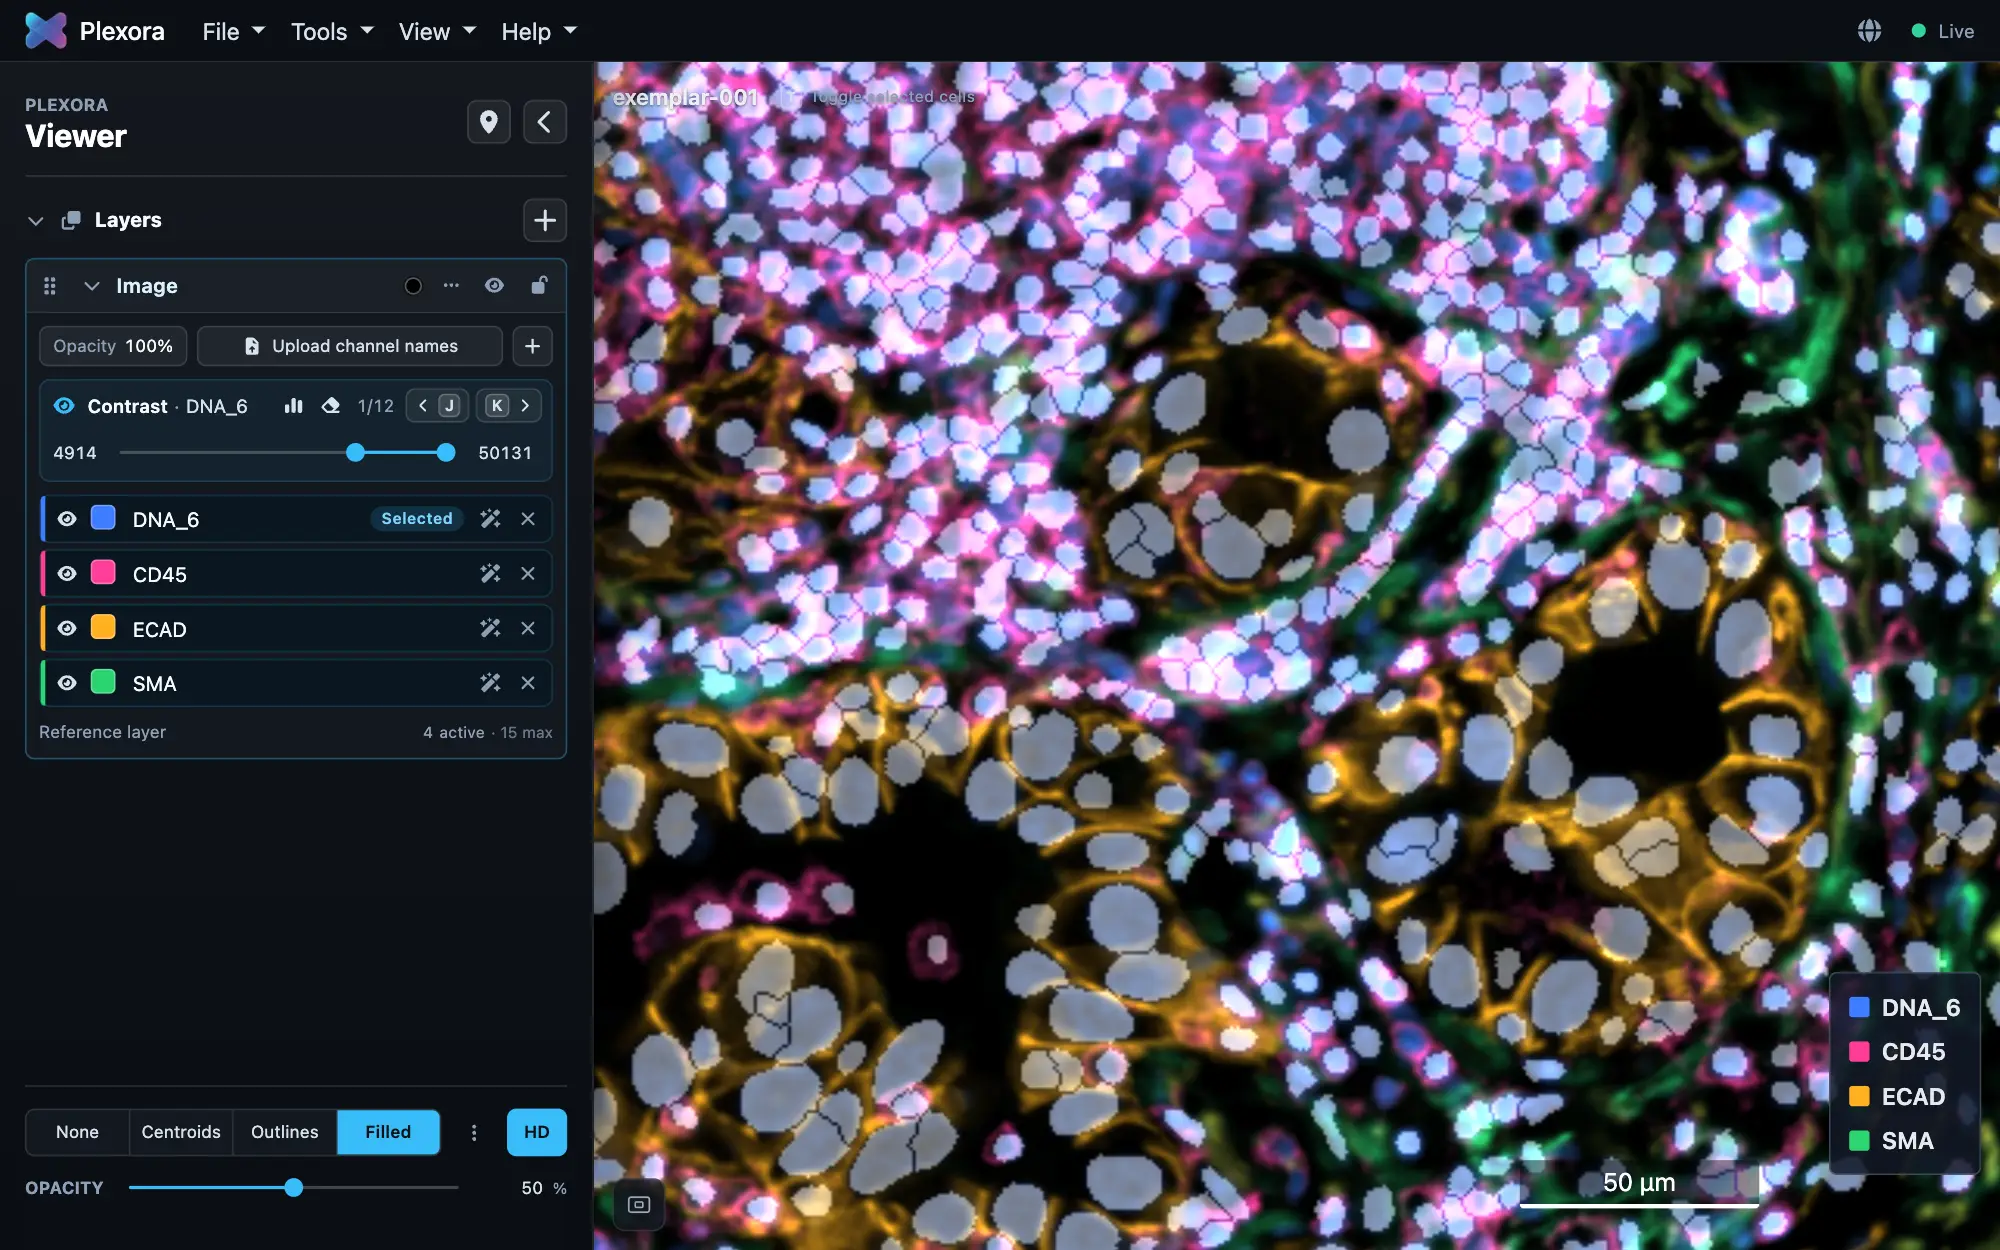
Pick one of None, Centroids, Outlines or Filled. Centroids draws a point per cell and adds a Point size slider; Outlines and Filled need a mask. Opacity fades whatever is drawn.
Answer the table's questions, once
The first time a tool needs to know, Plexora asks which column is the Cell ID column, which hold the X and Y coordinates, and which columns are markers and which are metadata. It guesses from the column names and shows the guess for you to confirm. The answer is kept with the sample and never asked again.
Tips
- Press T to hide the cells and see the bare tissue, and T again to bring them back exactly as they were.
- HD, at the end of the Cells row, reloads the image at full resolution; it may be slower.
- The ⋮ beside the Cells row replaces the mask, or reads the file as an image layer instead if it was detected as a mask by mistake.
- A table with no mask still works: tools draw cells as points at their coordinates.